
Everything a model needs
Quantity, price, cost, supplier, reorder level, custom fields, expiry batches and timestamps for every API-visible item, in one GET.
Building your own dashboard, forecast model, or inventory app — with a spreadsheet, a no-code tool, or an AI coding assistant? Use Inventory Inventory as the stock backend. Your staff count and scan in the included apps; your software reads live stock through the REST API and does the analysis.
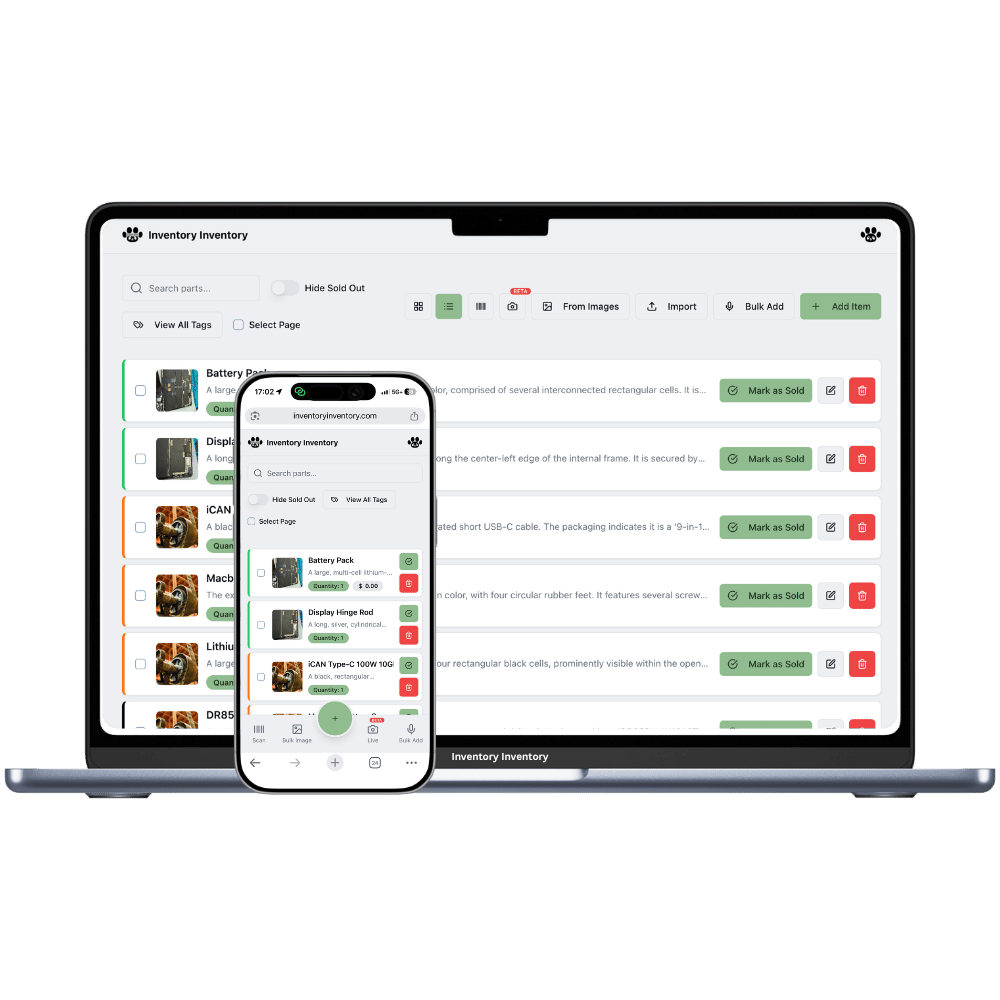
More and more businesses build their own tools now — a Google Sheet with the exact columns the owner cares about, a Streamlit dashboard, a small app written with ChatGPT, Claude or Copilot over a weekend. What those projects always need underneath is a trustworthy stock number: who has counted what, which batch expires first, what came in on the last delivery, what just sold on Square. That is the part nobody wants to write, and it is the part Inventory Inventory provides.
The pattern is simple. Your team receives, counts, scans and adjusts stock in the Inventory Inventory web app and the iPhone and Android apps — no admin screens for you to build. Your own software calls the REST API, gets every API-visible item as JSON with quantity, price, cost price, supplier, reorder level, custom fields and expiry batches, and does whatever you like with it: turnover charts, sell-through, margin by supplier, demand forecasts, an expiry-risk report, a wall display in the shop. When your storefront sells something, it posts a deduction and the platform handles the rest.
A spreadsheet is a perfectly good custom app. Google Sheets and Excel can both pull JSON from a URL with a Bearer token, so a live "stock on hand" tab that refreshes itself takes minutes to set up, and every formula, chart and pivot you already know works on top of it.
What the API does today: read inventory, and record sales. Items are created and edited in the apps or by spreadsheet import, and history-based analysis starts from the day your tool begins storing snapshots, since the API returns current state rather than the activity log. A write API and an activity feed are the two most-requested next steps; the Request a Feature page is how they get prioritised.
Quantity, price, cost, supplier, reorder level, custom fields, expiry batches and timestamps for every API-visible item, in one GET.
Google Sheets, Excel, Power BI, Looker Studio, Python, n8n, Zapier, Make — anything that can fetch JSON with a header.
Plain REST, JSON, a Bearer header and stable ids. Paste the documentation into ChatGPT, Claude or Copilot and get a working client on the first try.
Counting, receiving and barcode scanning happen in the web app and the phone apps. You never build a data-entry screen.
FEFO batches, reorder points, draft purchase orders, expiry alerts and Square and Shopify sync all run on the platform after every change.
API sales, store sales, phone scans and manual edits deduct the same record in transactions that never go below zero, so your analysis is on the real figure.
Inventory logic is deceptively deep. Rent the counting, batching, alerting and syncing, and spend your effort on the analysis that is specific to your business.
Sign up, import your catalogue from a spreadsheet or add items by photo, voice or hand, and start scanning in the apps.
On the Pro plan, mark the items your tool may read and generate a Bearer token from your profile.
One GET returns your inventory as JSON. Chart it, forecast it, put it in a sheet. Post sales back when your app sells something.
Yes, and it is the most common way developers use the API. Your tool calls the GET endpoint on a schedule, receives every API-visible item with quantity, price, cost price, supplier, reorder level, custom fields and expiry batches, and builds charts, turnover and margin reports, sell-through and demand forecasts on top. Store each pull if you want stock-over-time, since the API returns current state rather than the activity log.
Yes. Both can fetch JSON from a URL with an Authorization header — Google Sheets through Apps Script, Excel through Power Query — so a live stock tab that refreshes itself takes a few minutes to set up. From there, every formula, chart and pivot table you already know works on live data. Excel export from the app is also available on paid plans if you prefer a file.
It was designed for exactly that. The API is small and conventional: REST, JSON, a Bearer token, stable item ids, two endpoints. Paste the documentation page into your assistant and ask for a client in your language of choice; the result usually works first time. The site also publishes a plain-text summary at /llms.txt that AI crawlers and assistants read.
Yes. Your site reads quantities from the API and posts a deduction on each sale. The deduction is transactional, never goes below zero, takes from the soonest-expiring batch first, appears in the activity log as an API sale, and triggers alerts, auto-reorder and the Square and Shopify pushes like any other sale. Product descriptions and photos for your storefront stay in your own CMS; the platform holds the stock truth.
It cannot create or edit items, add stock for receiving, or return the activity history. Those happen in the web app, the mobile apps and spreadsheet import today. A write API and an activity feed are the two most-requested additions; ask for them on the Request a Feature page if your project needs them, and they move up the roadmap.
API access is included in the Pro plan at $10 per month, with the AI features, imports, purchasing and store integrations. Larger plans raise the item ceiling and add team members. There is no separate API tier and no per-call pricing.
Start free with 50 items — no credit card, no trial countdown. Import your spreadsheet and you have a working system in minutes.